
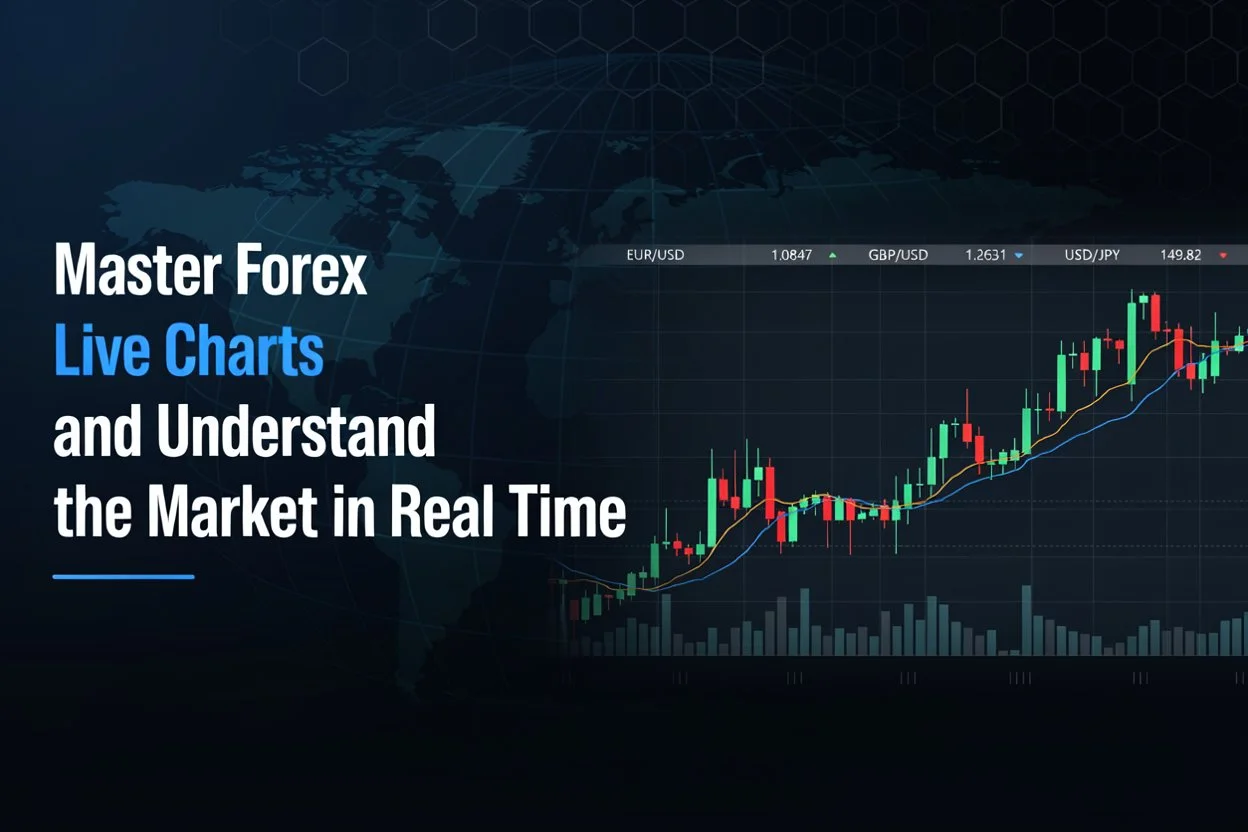
Master Forex Live Charts and Understand the Market in Real Time
Currency prices don’t wait for anyone. A headline drops, a central bank hints at a rate change, or a major economy releases jobs data, and within seconds, price action shifts. If you’re trading on delayed information, you’re already a step behind. This is exactly why so many traders, from beginners to seasoned professionals, have made the forex live chart their most trusted tool. It strips away the guesswork and shows you exactly what the market is doing, as it happens.
If you’ve ever felt overwhelmed staring at a chart full of candles, lines, and numbers, you’re not alone. The good news is that once you understand what you’re looking at and why it matters, reading a live chart becomes second nature. Let’s break down what these charts actually do, how to use them effectively, and why real-time data changes the way you approach the forex market.
Why Real-Time Data Changes Everything
Forex is the largest and most liquid financial market in the world, with trillions of dollars changing hands every single day. Prices move constantly across sessions in Tokyo, London, and New York, often reacting within moments to economic releases, geopolitical news, or shifts in investor sentiment.
A static or delayed chart simply can’t keep up with that pace. By the time you see the information, the opportunity may have already passed. A live chart, on the other hand, updates continuously, giving you an accurate, current picture of price movement. This matters whether you’re scalping short-term moves, swing trading over a few days, or simply keeping an eye on a currency pair before making a longer-term decision.
Real-time visibility also helps with something traders often underestimate: confidence. When you can see the market moving in front of you rather than relying on outdated snapshots, your decisions are grounded in what’s actually happening, not what happened ten minutes ago.
Getting Comfortable With the Basics
Before diving into advanced strategies, it helps to get familiar with the building blocks of any chart.
- Candlesticks: Candlesticks are the most common way price is displayed. Each candle represents a specific time period and shows the opening price, closing price, and the highest and lowest points reached during that window. Green or white candles typically indicate the price closed higher than it opened, while red or black candles show the opposite.
- Timeframes: Timeframes let you zoom in or out on the market. A one-minute chart is useful for very short-term trades, while a daily or weekly chart gives you a broader sense of the overall trend. Many traders switch between timeframes to get both the big picture and the finer details.
- Volume and momentum indicators: Volume and momentum indicators add another layer of insight, showing not just where price is heading, but how strong that movement actually is.
None of this is complicated once you spend a little time with it. The key is consistency: watching the same pairs, the same timeframes, and building a feel for how price typically behaves.
Making the Most of a Forex Live Chart
Simply having access to live data isn’t enough on its own. How you use it makes the real difference. Start by identifying the currency pairs you actually care about. Trying to watch every pair at once leads to information overload. Most traders focus on a handful of majors, like EUR/USD, GBP/USD, or USD/JPY, and get to know their typical behavior, volatility patterns, and reaction to news events.
Next, layer in a few indicators that suit your style, but resist the temptation to overload your screen. Moving averages, support and resistance zones, and trendlines are often enough to build a clear picture without cluttering the view. It’s also worth paying attention to the economic calendar alongside your chart. Interest rate decisions, employment reports, and inflation data all tend to trigger sharp, real-time reactions.
Watching how price behaves around these events, live, teaches you far more than reading about it after the fact. Finally, practice patience. Real-time charts can tempt traders into overtrading simply because there’s always movement to react to. The most successful traders learn to wait for setups that match their strategy rather than chasing every tick.
Turning Observation Into Strategy
Watching a chart is one thing; using it to build a repeatable process is another. A useful approach is to combine what you see on the live chart with a clear plan you’ve already thought through, before the market gets emotional. Set your entry and exit points based on logic, not impulse. Use the live chart to confirm that conditions match your plan rather than to invent new plans on the fly.
Over time, this discipline separates traders who consistently improve from those who simply react to whatever the market throws at them. It also helps to review your trades afterward using historical data on the same chart. Comparing what you expected to happen against what actually happened, in real time, is one of the fastest ways to sharpen your instincts.
Conclusion
Understanding forex markets in real time requires more than simply watching prices move. Traders need accurate information, disciplined analysis, and a clear strategy to interpret changing market conditions effectively. A dependable forex live chart can make this process easier by providing an up-to-date view of price action, trends, and potential market opportunities. By combining live chart analysis with sound risk management and patience, traders can avoid impulsive decisions and stay focused on their trading objectives.
TradeView supports this approach by offering resources that can help traders follow market movements and make better-informed decisions. Ultimately, successful trading depends on preparation, consistency, and the ability to respond thoughtfully to real-time market information.